
Glossary · KPIs & analysis
What is an ABC analysis?
An ABC analysis shows you which few items hold most of your money. Here you’ll learn how it works and where businesses get it wrong – and with our tool, you can run it for your own store in two minutes.
In brief
ABC analysis is a method that divides items into three classes according to their share of total value. A items are the few that account for the largest share of consumption value – a cut-off at 80% is common. B items make up roughly the next 15%, C items the rest. This shows you where precise planning, lean stock levels and price negotiations pay off most.
ABC analysis: definition
ABC analysis is a method for ranking a large number of similar things – in a store, usually items – by their economic importance. It is based on an observation known as the Pareto principle: a small share of the causes explains a large share of the effect. In a store, that often means roughly 20% of items account for around 80% of consumption value.
The class cut-offs are not a standard. Common choices are 80 / 15 / 5% or, slightly milder, 70 / 20 / 10% of value – what matters is that you set them for your business and apply them consistently in every analysis.
The usual basis is annual consumption value, i.e. quantity used times cost price. Depending on the question, you can also sort by revenue, contribution margin or stock value. For purchasing and stock planning, though, consumption value is almost always the right choice.
How to do an ABC analysis in 5 steps
All you need is an item list with quantities and prices. Here’s how:
- Collect dataQuantity used in the last 12 months and cost price per item.
- Calculate valueQuantity × price gives the consumption value of each item.
- SortIn descending order of consumption value – the most expensive item at the top.
- AccumulateCalculate the share of total value and add it up from the top.
- ClassifyUp to 80% cumulative is A, up to 95% B, the rest C.
The formula
Share of value = consumption value ÷ total value × 100
- Consumption value
- Annual quantity × cost price of an item
- Cumulative
- Sum of the value shares of all items up to and including this one
- A · B · C
- cumulative up to 80% · up to 95% · above
In Excel, three helper columns are enough: =B2*C2 for the value, =D2/SUM(D:D) for the share and =SUM($E$2:E2) for the cumulative share. It’s quicker with the tool here on the page.
ABC analysis online: paste your list, see the result
Copy your item list from Excel and paste it in – with two columns (item, consumption value) or three columns (item, quantity, price). The tool sorts, accumulates, classifies and draws the Pareto curve. The calculation runs entirely in your browser; no data is transmitted.
The ABC analysis tool requires JavaScript. Please enable JavaScript in your browser.
Example: ABC analysis at a plumbing and heating business
Last year, the business installed material worth around €69,760 from its own store. Sorted by consumption value, three items are far ahead:
- Copper pipe 15 mm: 900 lengths × €28.50
€25,650 - Press fittings 15 mm: 3,600 pieces × €3.20
€11,520 - NYM-J sheathed cable: 120 coils × €89.00
€10,680 - The remaining 17 items combined
€21,908
| Class | Item | Share of value | Includes, for example |
|---|---|---|---|
| A | 5 (25 %) | around €53,770 · 77% | Copper pipe, press fittings, cable, radiator valves, silicone |
| B | 7 (35 %) | around €12,010 · 17% | Thermostatic heads, gloves, screws, wall plugs, pipe insulation |
| C | 8 (40 %) | around €3,980 · 6% | PTFE tape, insulating tape, hemp, cable ties, threaded rods |
If the business buys copper pipe and press fittings 5% cheaper, it saves around €1,860 a year – almost half of what the entire C class is worth. Conversely, it isn’t worth counting PTFE tape and hemp every week: for C items, a generous minimum stock is enough.
Try it yourself: in the tool above, “Load example” loads exactly these 20 items.
What follows from A, B and C?
The analysis is only the first step. It only becomes valuable once you treat the three classes differently:
Manage closely
- Plan lean stock levels, review the reorder point regularly
- Negotiate prices and framework agreements
- Order more often, but in smaller quantities
- Count more often during stocktaking, e.g. quarterly
Review regularly
- Fixed ordering rules with reorder point and maximum stock
- Adjust values once or twice a year
- Bundle orders with the same supplier
Keep it simple
- Generous safety stock instead of fine-tuning
- Order less often, but in larger quantities
- Replenishment via Kanban or two-bin system
Caution: C doesn’t mean unimportant. A missing 40-cent seal can stop a job site just as surely as a missing copper pipe. That is why many businesses supplement the ABC analysis with an XYZ analysis or flag critical parts separately.
5 common ABC analysis mistakes
- Sorting by quantity instead of value. Then screws end up in class A, even though they tie up hardly any capital.
- Using stock value instead of consumption value. An expensive slow mover looks like an A item, even though it never moves. For slow movers, inventory turnover is the better metric.
- Calculating once and never repeating. Product range, prices and orders change. Reclassifying once or twice a year keeps the classes up to date.
- Neglecting C items. Cheap doesn’t mean non-critical. Supply risk needs to be assessed separately.
- Calculating with messy data. If withdrawals aren’t booked, the usage figures are wrong – and the whole analysis falls apart with them.
The data basis for your ABC analysis
An ABC analysis is only as good as the usage figures behind it. In Scanwiz, every withdrawal is booked by scan – on your phone, at the issue counter or on the job site. Use the Excel export to get your item data out and paste it straight into the tool above.
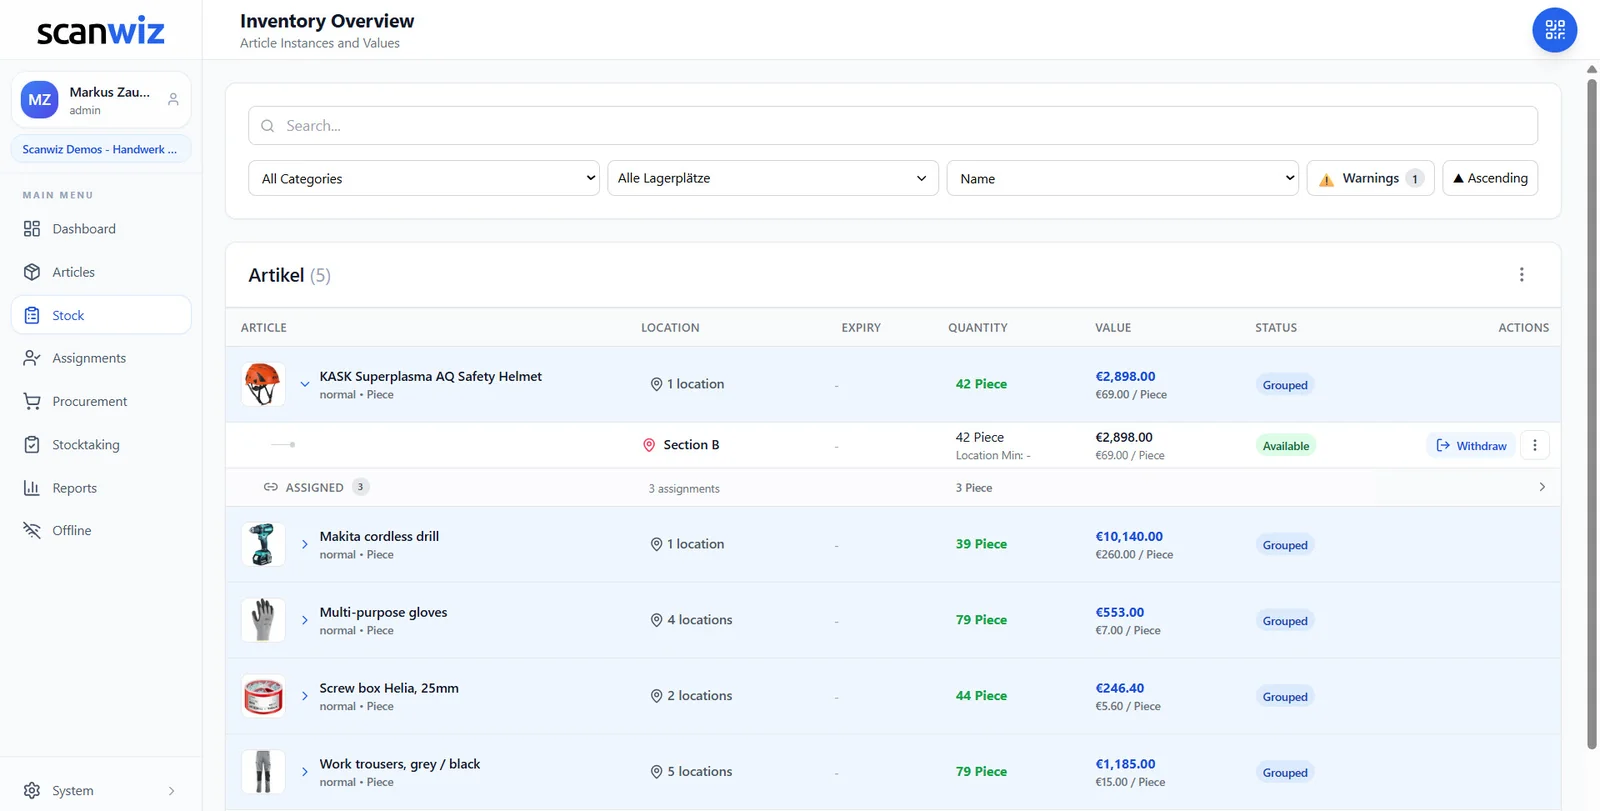
- Withdrawals by scan with phone camera, USB or Bluetooth scanner
- Minimum stock per item – anything that falls below goes on the shopping list
- Stocktaking by scan, also as cycle counts for A items in between
Frequently asked questions about ABC analysis
What is an ABC analysis in simple terms?
You sort your items by how much money flows through them and split them into three groups: A items are the few expensive lines with the largest share of value, C items the many cheap small parts. That way you know where a close look pays off.
What cut-offs apply in an ABC analysis?
There is no binding standard. Common choices are 80 / 15 / 5% or 70 / 20 / 10% of cumulative value. What matters is that you decide on one split and apply it consistently in every analysis.
What is the difference between ABC and XYZ analysis?
ABC analysis asks how much value an item has. XYZ analysis asks how evenly it is used: X constant, Y fluctuating, Z irregular. Combined, they form a matrix – AX items can be planned tightly, CZ items rather with a generous buffer.
How often should you do an ABC analysis?
Once or twice a year is enough for most businesses, for example before the stocktake or before annual talks with suppliers. For highly seasonal businesses, a shorter cycle is worthwhile.
Can I do an ABC analysis in Excel?
Yes. You need columns for quantity, price, consumption value, share and cumulative share, and sort in descending order of value. It’s quicker to paste the list into the free tool on this page.
Do tools belong in the ABC analysis?
Not in the ABC analysis of materials, because tools aren’t consumed but used and returned. For work equipment, other questions matter: where is the device, who has it and when is the next inspection due.
Sources & methodology
- Lexware Unternehmerlexikon (German): ABC-Analyse – definition, class cut-offs and procedure. lexware.de, accessed 10 Nov 2026.
- WHK Controlling (German): ABC-Analyse – guide and examples, classic cut-offs 80 / 15 / 5. whk-controlling.de, accessed 10 Nov 2026.
- Worked example: Scanwiz’s own calculation with realistic sample data from a plumbing and heating business; amounts rounded.
Updated November 2026 · Scanwiz editorial team
More from the glossary
Related to ABC analysis.
Safety stock
→How much reserve makes sense – tight for A items, generous for C items. With stock calculator.
Reorder point formula
→Formula, examples from trades and medical practices, and the point at which you reorder.
All terms
→The whole glossary from A for ABC analysis to X for XYZ analysis – with search and topic filter.
Over 250 customers already trust Scanwiz
A items in view, C items under control.
Withdrawals by scan, minimum stock per item and a shopping list that fills itself. Try Scanwiz free for 14 days – no credit card required. Or let us show you everything in a personal demo.


