
Glossary · KPIs & analysis
What is the carrying cost rate?
Every euro on the shelf costs money – for interest, space, staff and shrinkage. The carrying cost rate tells you exactly how much: as a percentage of inventory value per year. Here you will learn how to calculate it and what you need it for.
In brief
The carrying cost rate (also holding cost rate) shows the annual cost of holding inventory relative to average inventory value – as a percentage. It is calculated as holding costs divided by average stock in euros, times 100. A rate of 20% means: every euro in stock costs 20 cents a year.
Carrying cost rate: definition
Material in stock is not free just because it has already been paid for. As long as it sits there, it ties up capital, takes up space, gets counted, moved and insured – and some of it spoils, becomes obsolete or disappears. The carrying cost rate combines all these costs into one number and relates them to the value of the inventory.
This turns a vague feeling (“our warehouse is too full”) into a number you can calculate with: you know what an extra euro of stock costs you every year – and what you save when you reduce stock.
Calculating the carrying cost rate
Formula
Carrying cost rate = holding costs per year ÷ avg. stock in € × 100
- Holding costs
- All annual costs caused by storage (see components below)
- Avg. stock
- Average inventory value at cost, e.g. (opening + closing stock) ÷ 2
The cost components
- Tied-up capital: interest on the capital tied up – either real loan interest or lost interest if the money could otherwise be invested.
- Storage space: rent or depreciation of the space, shelving, energy, heating, maintenance.
- Staff: putting away, picking, counting, stocktaking – the share attributable to the warehouse.
- Shrinkage and obsolescence: theft, breakage, expired material, slow movers that are written off.
- Insurance and other: insurance of the stock, warehouse administration, software.
Example: building materials at a construction company
The business wants to know what its material store costs per year. It collects the costs from its accounts and estimates:
- Tied-up capital: 6% interest on €120,000
€7,200 - Share of hall, energy, shelving
€6,000 - Warehouse staff, pro rata
€4,800 - Shrinkage, breakage, write-offs
€3,600 - Insurance and other
€2,400 - Total ÷ €120,000 × 100
€24,000 = 20%
So every euro in the depot costs 20 cents a year. If the business clears €20,000 of material that has not moved for over a year, it saves around €4,000 annually – part of it immediately, such as interest and shrinkage, and part only in the medium term, once space is freed up.
What you need the rate for
Order quantity
- Required input in the EOQ formula
- High rate → order smaller and more often
Stock targets
- Shows what excessive reserves cost
- Helps weigh up safety stock
Volume discounts
- Is buying in bulk really worth it?
- Compare the discount with holding costs
An example of the last point: if the dealer offers a 3% discount for taking six months’ demand at once instead of monthly, the material sits about two and a half months longer on average. At a 20% annual cost rate, that costs a little over 4% of the purchase value – so the discount does not pay off.
Optimal order quantity with your rate
Enter your carrying cost rate in the calculator and see which order quantity results – according to the EOQ formula.
The calculator needs JavaScript. Please enable JavaScript in your browser.
4 typical mistakes with the carrying cost rate
- Only counting interest. Leaving out space, staff and shrinkage makes the rate far too low – and storage look too cheap.
- One rate for everything. Perishable or quickly outdated material has a higher rate than screws. With big differences, separate rates per item group pay off.
- Valuing at selling prices. Inventory value belongs in the calculation at cost.
- Calculating once and never again. Interest rates, rents and energy prices change. An annual check keeps the rate realistic.
Carrying cost rate and inventory interest rate
The two are often confused. The carrying cost rate includes all costs of holding inventory. The inventory interest rate only looks at tied-up capital and converts the annual interest to the average storage period: annual interest rate × avg. storage period in days ÷ 360. So it is part of the whole.
Know your inventory value with Scanwiz
For the carrying cost rate you need a reliable inventory value. In Scanwiz you see quantity and value per item and storage location, withdrawals are recorded by scan, and the Excel export brings the figures into your calculation. Regular stocktakes keep the values correct throughout the year.
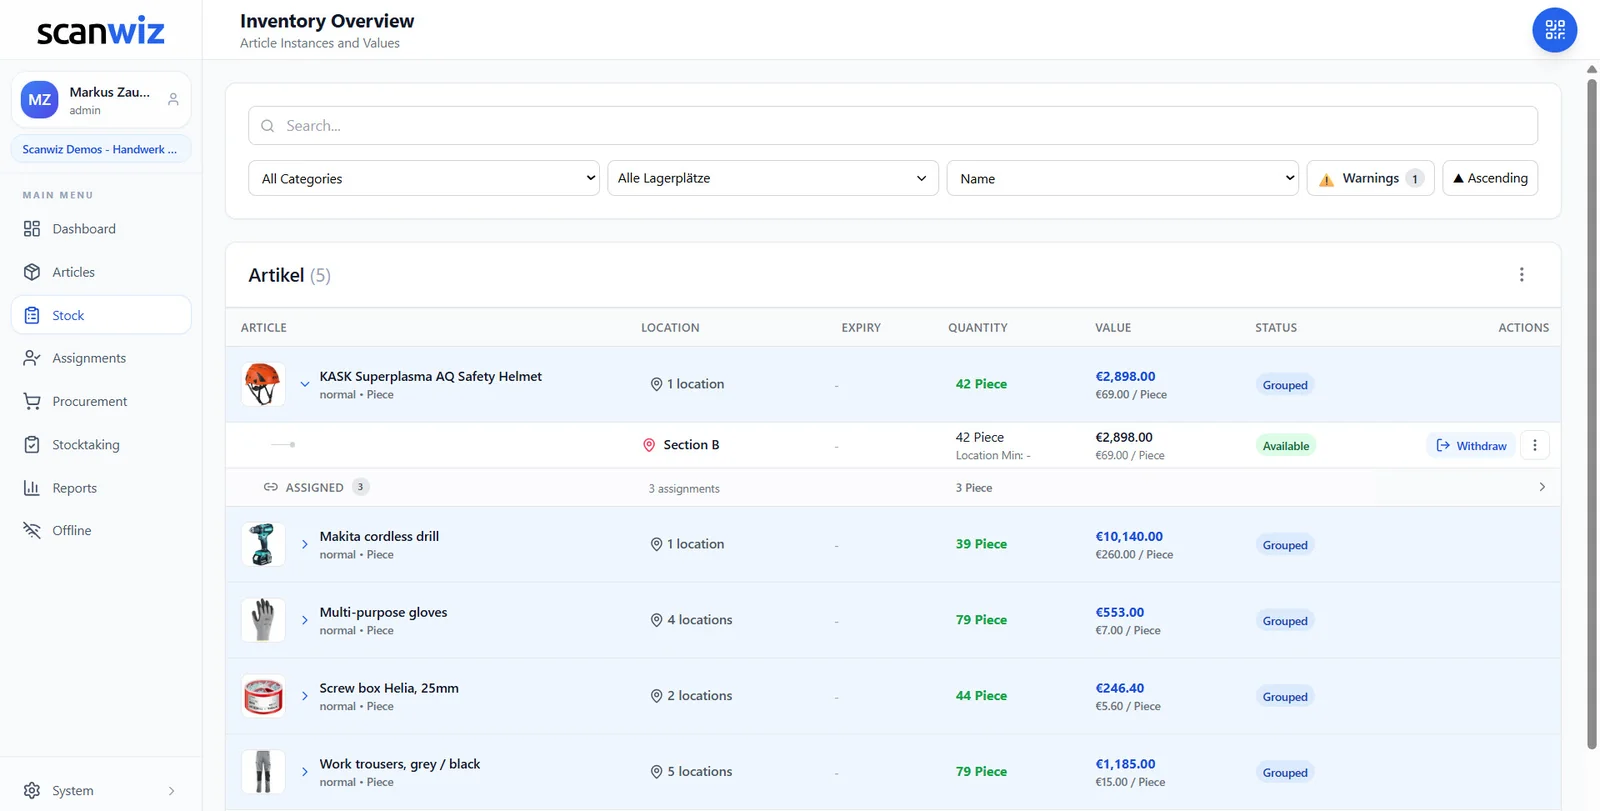
- Quantity and value per item and storage location
- Withdrawals by scan, even offline
- Excel export for your calculation
Frequently asked questions about the carrying cost rate
What is the carrying cost rate?
The carrying cost rate shows the annual cost of holding inventory as a percentage of average inventory value. At 20%, every euro in stock costs 20 cents a year.
How do you calculate the carrying cost rate?
Holding costs per year divided by average stock in euros, times 100. The costs include tied-up capital, storage space, staff, shrinkage and insurance.
What is a typical carrying cost rate?
That depends heavily on interest rates, space and material. Only your own calculated value is reliable – as a rough guide, values between 10 and 30% are often quoted in practice.
What is the difference from the inventory interest rate?
The inventory interest rate only looks at interest on tied-up capital, converted to the storage period. The carrying cost rate includes all costs of holding inventory.
Sources & methodology
- Wikipedia: Carrying cost – components of holding costs. en.wikipedia.org, accessed 10 November 2026.
- Wikipedia (German): Lagerkennziffer – carrying cost rate and inventory interest. de.wikipedia.org, accessed 10 November 2026.
- Worked example: Scanwiz’s own calculation with realistic assumptions for a construction company.
Updated November 2026 · Scanwiz editorial team
More from the glossary
Related to the carrying cost rate.
Over 250 customers already trust Scanwiz
From the glossary to your warehouse – Scanwiz does the rest.
Minimum stock, stocktakes, inspection intervals and batches run automatically in Scanwiz as part of your daily work. Try it free for 14 days with your whole team – no credit card required. Or let us show you everything in a personal demo.


