
Glossary · KPIs & analysis
What are days of inventory?
How long will what is on the shelf right now last you? Days of inventory turn stock into days – showing you whether things are getting tight or too much material is lying around. Here you will learn how to calculate and use this KPI.
In brief
Days of inventory (also stock coverage or days on hand) show how many days stock will last at average consumption. They are calculated as stock divided by average consumption per day. Calculated with current stock, they warn of shortages; calculated with average stock, they show how much material is permanently held in reserve.
Days of inventory: definition
Days of inventory – also stock coverage or days of supply – convert stock into time. “We still have 36 bottles” says little. “We can manage for another 24 working days” tells you right away whether action is needed.
In practice, there are two perspectives:
- Current coverage: calculated with today’s stock. It answers: when will we run out of material – and will the replenishment arrive in time?
- Average coverage: calculated with average stock. It answers: how many days of supply do we hold on average – too much, too little?
Calculating days of inventory
Formula
Coverage = stock ÷ avg. consumption per day
- Stock
- Current or average stock in units (or in euros)
- Avg. consumption per day
- Annual consumption ÷ working days – or consumption of recent weeks if it fluctuates
Use the same time unit as your delivery times. If the supplier counts in working days, calculate coverage in working days – otherwise you are comparing apples and oranges.
Days of inventory calculator
Enter annual consumption, stock and working days. The calculator shows the coverage of current stock in working days – plus inventory turnover and storage period. The example below is pre-filled.
The calculator needs JavaScript. Please enable JavaScript in your browser.
Example: disinfectant at a dental practice
The practice uses around 330 bottles a year over 220 working days. Today there are 36 bottles in the storeroom. The dealer delivers in 3 working days, and the practice orders once a week.
- Consumption per day: 330 ÷ 220
1.5 bottles - Coverage today: 36 ÷ 1.5
24 working days - Needed until the next delivery: 5 + 3 days
≈ 12 bottles - Permanently in reserve
≈ 4 weeks
There is no risk of a shortage – quite the opposite: only around 12 bottles are needed until the next weekly order arrives. So in future the practice only tops up to about 15 bottles (12 plus a reserve of 3) and sets a reorder point of 8 bottles as a safety net: 3 days of delivery time × 1.5 plus the reserve. That is less than half of today’s supply – with less space needed in the storeroom and fewer bottles reaching their expiry date.
Reading coverage and delivery time together
Coverage shorter than delivery time
- Shortage very likely
- Order immediately, express delivery if needed
Coverage ≈ delivery time + reserve
- Just right: order now
- That is the reorder point
Coverage much longer
- No need to reorder
- But check: is that too much stock?
Days of inventory and inventory turnover
Both KPIs describe the same thing from two directions. Inventory turnover counts how often average stock turns over in a year. Average coverage counts how many days this stock lasts. High coverage means low turnover – and vice versa. For day-to-day control, coverage is more intuitive; for year-on-year comparison, turnover is.
4 typical mistakes with days of inventory
- Mixing calendar days and working days. If you spread consumption over 365 days but know the delivery time in working days, you misjudge coverage.
- Ignoring seasonal consumption. More road salt is needed in winter than in summer. If consumption fluctuates, use the consumption of recent weeks.
- Counting reserved goods. What is already promised to a job or site is no longer freely available.
- Calculating with outdated stock. Coverage is only as good as the stock figure it is based on.
Spot shortages early with Scanwiz
So you do not have to keep calculating coverage, you set a minimum stock per item, variant or storage location in Scanwiz. If stock falls below it, the item automatically lands on the shopping list – sorted by supplier. Because every withdrawal is recorded by scan, the stock figure behind it is up to date.
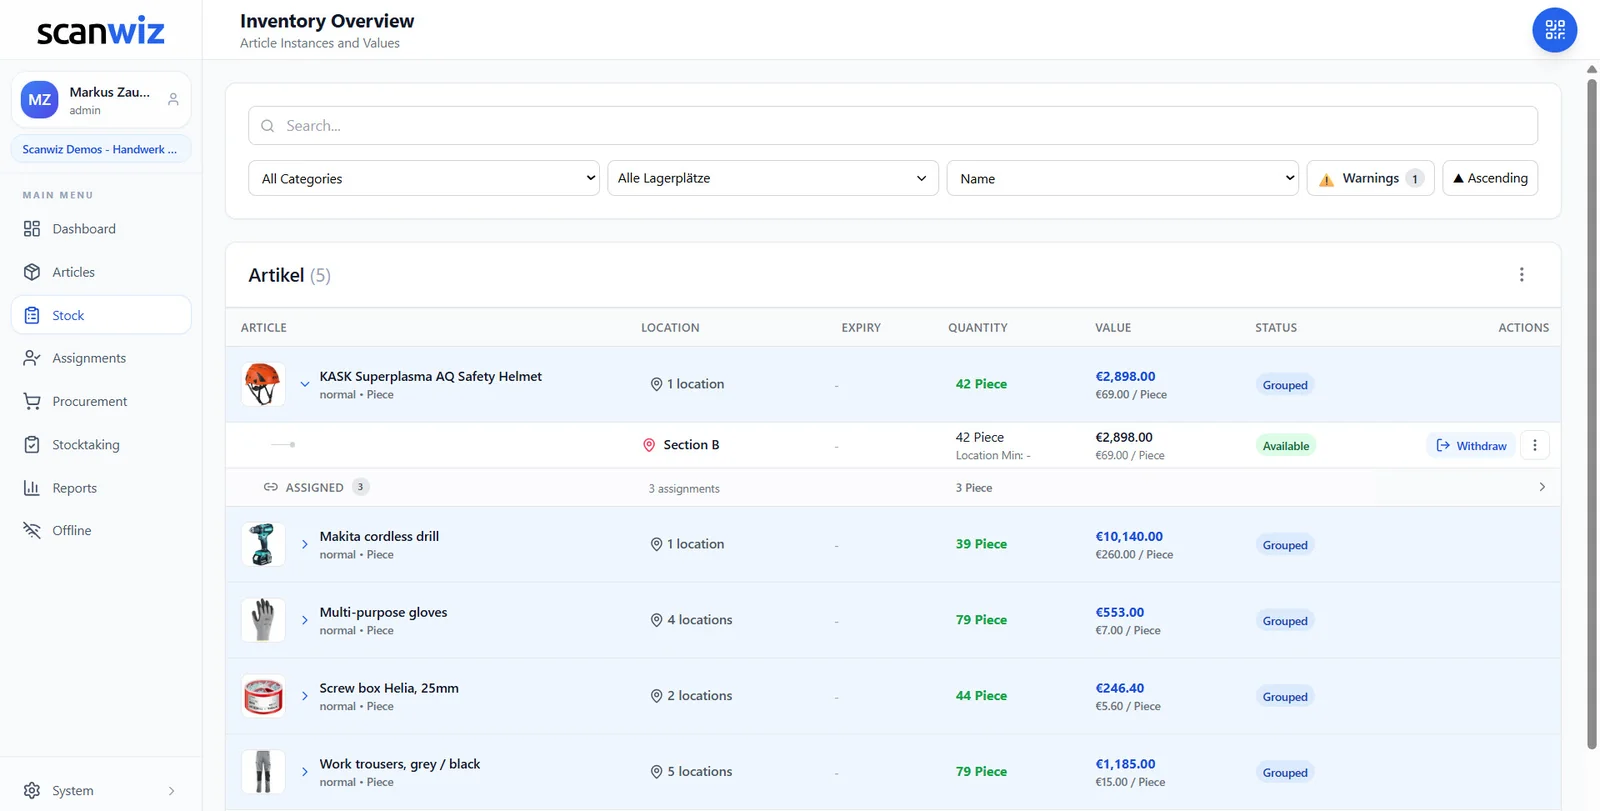
- Minimum stock per item, variant, storage location
- Automatic shopping list by supplier
- Withdrawals by scan, even offline
Frequently asked questions about days of inventory
What are days of inventory?
Days of inventory show how many days stock will last at average consumption. They are calculated as stock divided by average consumption per day.
How do you calculate coverage in days?
Divide stock by consumption per day. With 36 bottles and a consumption of 1.5 bottles per day, the stock lasts 24 days.
What is a good stock coverage?
Coverage should at least cover delivery time plus ordering cycle plus a reserve. If it is permanently far above that, too much capital is probably tied up in stock.
What is the difference between days of inventory and inventory turnover?
Inventory turnover counts how often average stock turns over in a year. Coverage counts how many days a stock lasts. High coverage means low turnover.
Sources & methodology
- Wikipedia (German): Reichweite (Logistik) – definition and formula. de.wikipedia.org, accessed 10 November 2026.
- Worked example: Scanwiz’s own calculation with realistic figures from a dental practice.
Updated November 2026 · Scanwiz editorial team
More from the glossary
Related to days of inventory.
Over 250 customers already trust Scanwiz
From the glossary to your warehouse – Scanwiz does the rest.
Minimum stock, stocktakes, inspection intervals and batches run automatically in Scanwiz as part of your daily work. Try it free for 14 days with your whole team – no credit card required. Or let us show you everything in a personal demo.


