
Glossary · KPIs & analysis
What is XYZ analysis?
ABC analysis shows where the money is. XYZ analysis shows how predictable an item is. Here you will learn how to measure variation in consumption and how the ABC/XYZ matrix works – and with our tool you can run the analysis for your own warehouse right away.
In brief
XYZ analysis classifies items by how evenly they are consumed. X items have constant consumption, Y items fluctuate, for example due to season or trend, and Z items are needed irregularly. It is usually measured with the coefficient of variation – the standard deviation of consumption divided by the mean. Combined with ABC analysis, this gives you the ABC/XYZ matrix.
XYZ analysis: definition
Two items can be consumed in exactly the same amount over a year and still be completely different to plan. Gloves go out in similar quantities every month. Flu vaccine is not needed at all for three months and then in large quantities. XYZ analysis makes this difference measurable.
It is the counterpart to ABC analysis: ABC analysis asks about value, XYZ analysis about predictability. Only together do they tell you how best to manage an item.
How XYZ analysis is calculated
Coefficient of variation
CV = standard deviation ÷ mean × 100
- Mean
- Average consumption per period, usually per month over 6 to 12 months
- Std. dev.
- How widely the individual months scatter around the mean – in Excel with STDEV.P
- X · Y · Z
- common: CV up to 25% · up to 50% · above
As with ABC analysis, the limits are not a standard. Some businesses work with 10 and 25%, others with 50 and 100%. What matters is to set a classification and stick to it.
XYZ analysis online
Paste one item per row with its monthly consumption – copied from Excel, for example. The tool calculates the mean, variation and coefficient of variation and classifies each item as X, Y or Z. The calculation runs entirely in your browser.
The XYZ analysis tool needs JavaScript. Please enable JavaScript in your browser.
Example: three items, three classes
- Nitrile gloves: 40, 42, 38, 41, 39, 40 boxes
CV 3% · X - Copper pipe: 50, 90, 70, 110, 60, 80 lengths
CV 26% · Y - Radiator valves: 5, 30, 12, 0, 25, 8 units
CV 81% · Z
Gloves can be planned almost to the box – a tight safety stock is enough. For copper pipe, demand varies with the jobs, so more buffer is needed. Radiator valves are hard to predict: either you keep generous stock or you only order once a job is confirmed.
The ABC/XYZ matrix
Combined, ABC and XYZ analysis give nine fields. Each one stands for a different strategy:
| X – steady | Y – fluctuating | Z – irregular | |
|---|---|---|---|
| A – high value | Plan tightly, frequent deliveries, low safety stock | Plan precisely, monitor consumption, medium buffer | Order per job where possible instead of storing |
| B – medium value | Fixed ordering rules with a reorder point | Reorder point with safety stock, review regularly | Decide individually: store or order when needed |
| C – low value | Kanban or two-bin system | Generous buffer, order rarely | Store generously – capital hardly matters |
4 typical mistakes with XYZ analysis
- Too short a period. Three months do not show a season. Six to twelve months are a good basis.
- Including one-off large orders. A special project quickly turns an X item into a Z item. Mark outliers.
- Classifying new items. Without enough history, the coefficient of variation says nothing.
- Using recorded instead of actual consumption. If withdrawals are entered in batches afterwards, every item looks more irregular than it is.
The data basis in Scanwiz
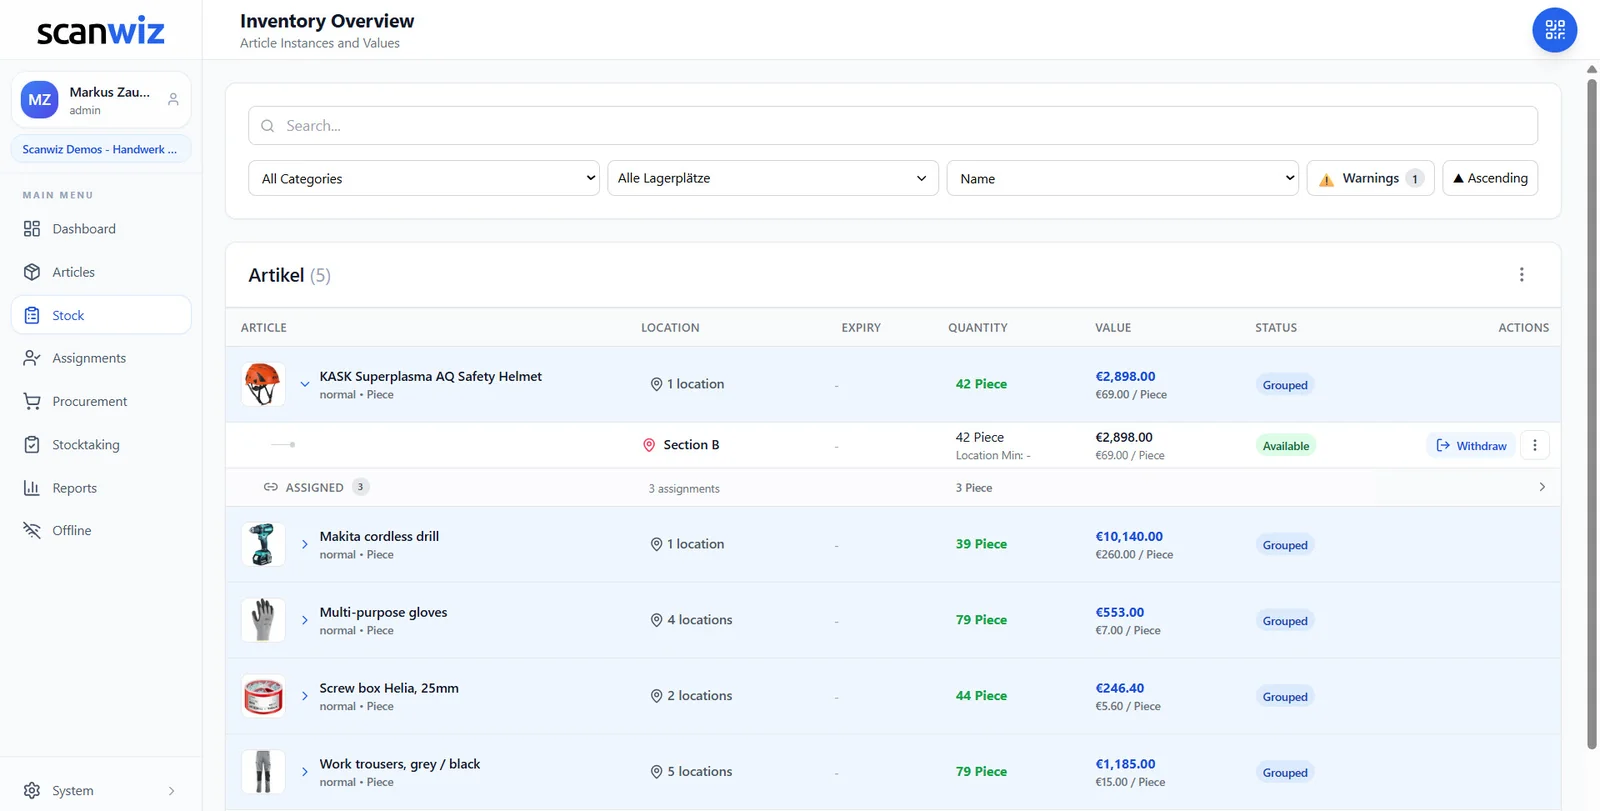
An XYZ analysis depends on consumption being recorded when it happens. In Scanwiz every withdrawal is captured by scan – on a phone, at the counter or on the construction site. This builds up a history that shows how an item is really used. Use the Excel export to pull out your item data for the analysis.
- Withdrawals by scan, even offline on the construction site
- Minimum stock per item – tight for X items, generous for Z items
- Excel export for your own analyses
Frequently asked questions about XYZ analysis
What is an XYZ analysis?
A method that classifies items by how evenly they are consumed: X items are consumed constantly, Y items fluctuate and Z items are irregular. It shows how well demand can be predicted.
How do you calculate an XYZ analysis?
For each item, the mean and standard deviation of consumption per period are calculated. The coefficient of variation is the standard deviation divided by the mean. A common rule: up to 25% X, up to 50% Y, above that Z.
What is the difference between ABC and XYZ analysis?
ABC analysis looks at an item’s share of total value, XYZ analysis at how predictable its consumption is. Together they form the ABC/XYZ matrix with nine fields.
Which period makes sense for an XYZ analysis?
At least six, ideally twelve months of monthly figures. That way seasonal swings become visible without individual weeks distorting the result.
Sources & methodology
- Wikipedia (German): XYZ-Analyse – method and classification. de.wikipedia.org, accessed 10 November 2026.
- Coefficient of variation in the example: own calculation using the population standard deviation (STDEV.P), rounded.
Updated November 2026 · Scanwiz editorial team
More from the glossary
Related to XYZ analysis.
Over 250 customers already trust Scanwiz
From the glossary to your warehouse – Scanwiz does the rest.
Minimum stock, stocktakes, inspection intervals and batches run automatically in Scanwiz as part of your daily work. Try it free for 14 days with your whole team – no credit card required. Or let us show you everything in a personal demo.


